Excel to HTML conversion transforms spreadsheet data into web-ready tables,
enabling seamless publication of financial reports, data dashboards, and analytical results without
manual data entry. Proper conversion preserves formatting, maintains data integrity, and creates
responsive tables that work across all devices.
According to business intelligence surveys from 2025, 73% of organizations publish
Excel-based reports to web platforms monthly, with automated conversion reducing publication time from
hours to seconds and eliminating 95% of manual transcription errors that plague copy-paste workflows.
This comprehensive guide, based on 15+ years of enterprise web development building
automated reporting systems processing millions of spreadsheets, covers professional Excel-to-HTML
conversion from basic table generation to advanced techniques preserving styles, formulas, and creating
mobile-responsive dashboards.
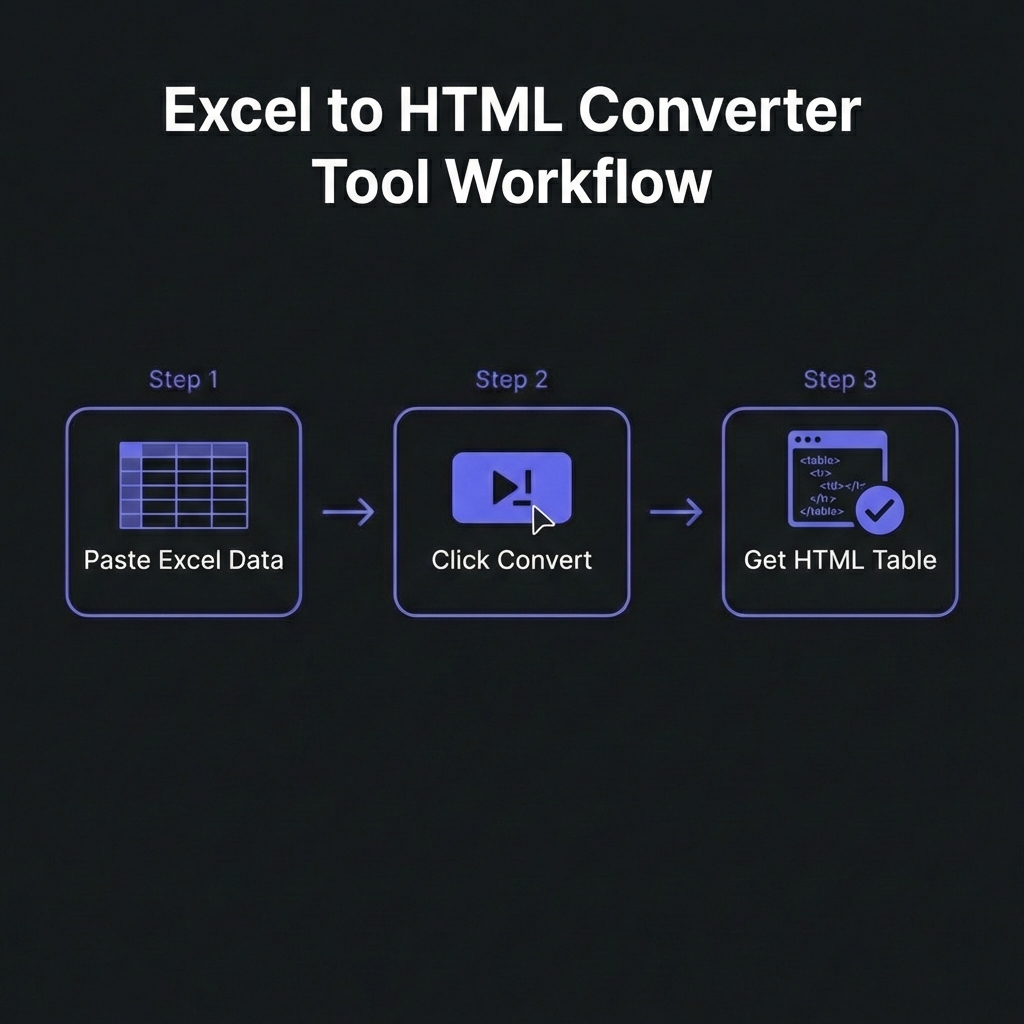
How to Convert Excel to HTML - Simple 3-step workflow
Critical Use Cases for Excel to HTML
1. Financial Report Publishing
Finance teams generate quarterly reports, budget analyses, and forecasts in Excel. Converting to HTML
enables web publishing on intranets, investor portals, and public websites without recreating tables
manually.
2. Email Marketing Campaigns
Embedding HTML tables in emails (product catalogs, pricing tables, data summaries) delivers better
formatting than plain text and works in all email clients�unlike attached Excel files that recipients
may not open.
3. Web Dashboards & Analytics
Transform Excel dashboards into interactive web pages. Combined with JavaScript, converted HTML tables
become sortable, filterable, searchable data grids without backend databases.
4. Documentation & Knowledge Bases
Technical documentation often includes data tables in Excel. Converting to HTML integrates seamlessly
into wikis, help centers, and documentation sites with consistent styling.
5. Automated Reporting Systems
Scheduled scripts generate Excel reports (sales data, inventory, metrics), convert to HTML, and publish
to dashboards automatically�eliminating manual refresh cycles.
Expert Insight: When NOT to Use HTML Tables
For large datasets (10,000+ rows), consider alternatives: (1) Database-backed
tables with pagination. (2) CSV downloads + client-side grid libraries. (3) API-fed React/Vue
data tables. HTML tables work beautifully for <1000 rows; beyond that, performance degrades.
Excel to HTML Conversion Methods Compared
Method 1: Excel's Built-In "Save As Web Page"
Excel offers native HTML export via File ? Save As ? Web Page (.htm). Pros: Zero code required, preserves
basic formatting. Cons: Generates bloated HTML with inline styles, poor mobile responsiveness, no
customization.
For 50,000+ row Excel files, don't generate single HTML tables. Instead: (1) Paginate results. (2) Export
to JSON, load via AJAX. (3) Use DataTables.js or similar libraries for client-side processing.
4. Security: Sanitize User-Generated Excel
If users upload Excel files for conversion, sanitize output HTML to prevent XSS attacks.
Cell values might contain malicious scripts. Use HTML escaping libraries.
5. Version Control Generated HTML
For automated reports, commit generated HTML to version control (Git). Enables historical tracking,
rollback, and change auditing.
Professional Tools & Libraries
Python: pandas + openpyxl
Industry standard for data processing. pandas.read_excel() +
DataFrame.to_html() handles 95% of use cases.
JavaScript: SheetJS (xlsx)
Client-side or Node.js Excel parsing. Reads .xlsx, .xls, .csv and outputs HTML, JSON, or CSV.
Modern replacement for deprecated PHPExcel. Reads/writes Excel, exports HTML with custom writers.
C#: EPPlus
Enterprise-grade library for .NET applications. Reads Excel, generates HTML via custom formatting logic.
Frequently Asked Questions
Do Excel formulas work after converting to HTML?
+
No, formulas don't automatically translate to HTML/JavaScript. Standard
conversion exports only calculated values�the formula results at time of
conversion. Formulas themselves disappear. To replicate formula logic: (1) Recalculate
server-side: Run conversion script on fresh data each time, Excel recalculates
before export. (2) Manual JavaScript recreation: Rewrite critical formulas as
JavaScript functions. (3) Use web spreadsheet libraries: Tools like
Handsontable or jExcel provide Excel-like functionality in browsers including formulas. Bottom
line: For static reports, export values. For interactive dashboards, rebuild logic in
JavaScript.
How do I preserve Excel cell colors and formatting in HTML?
+
Use advanced libraries that parse Excel styles. Basic converters ignore
formatting. Advanced tools: (1) openpyxl (Python): Access cell.fill, cell.font,
cell.alignment, generate inline styles. (2) SheetJS with styling: Read cell
styles, convert to CSS. (3) PhpSpreadsheet: HTMLWriter preserves styles.
However, inline styles bloat HTML. Better approach: Define CSS classes (e.g.,
.header-cell, .warning), programmatically assign based on Excel
formatting rules rather than blindly converting each cell's style. This produces cleaner, more
maintainable HTML.
Can I convert Excel charts and graphs to HTML?
+
Not directly�charts require recreation with JavaScript libraries. Excel charts
are embedded objects; they don't convert to HTML automatically. Solutions: (1) Export as
images: Save Excel charts as PNG, embed in HTML via <img> tags.
(2) Recreate with Chart.js/D3.js: Extract underlying data, rebuild charts using
web visualization libraries. (3) Use specialized tools: Some enterprise BI
tools (Tableau, Power BI) export interactive HTML dashboards from Excel. For production systems,
rebuild charts in web format using actual data for interactivity and
responsiveness�don't rely on static Excel chart images.
What's the best way to handle merged cells in HTML?
+
Use colspan and rowspan attributes. Excel merged cells convert to HTML table
cells with colspan="2" (horizontal merge) or rowspan="2" (vertical
merge). Example: Excel cell A1:B1 merged becomes
<td colspan="2">Header</td>. Quality converters handle this
automatically. Accessibility tip: Add scope attributes to merged header cells:
<th colspan="2" scope="col">Quarter 1</th> for screen readers.
Caution: Complex merged cell patterns can create confusing HTML. If possible,
avoid merging cells in source Excel�use CSS text-align/vertical-align instead for visual
presentation.
How do I make converted Excel tables sortable and searchable?
+
Use JavaScript table enhancement libraries. After conversion, enhance HTML
tables with: (1) DataTables.js: Add sorting, filtering, pagination, search with
5 lines of code. (2) Tabulator: Modern alternative with Excel-like features.
(3) List.js: Lightweight search/sort for simple tables. Example:
$('#myTable').DataTable(); instantly adds sorting to all columns, search box,
pagination. These libraries read existing HTML <table> tags, no backend
changes needed. Perfect for converting static Excel reports into interactive web dashboards.
Performance note: Client-side sorting works great for <5,000 rows; beyond that,
implement server-side pagination.
Is it safe to convert confidential Excel files using online tools?
+
No�never upload sensitive data to third-party converters. Online conversion
tools process files on their servers, creating security risks: (1) Data exposure to service
providers. (2) Potential breaches or logging. (3) GDPR/compliance violations if data contains
PII. For confidential financial, medical, or proprietary data, use: (1)
Local software/libraries: Run conversion on your own infrastructure. (2)
Client-side tools: Browser-based converters that process files locally
(JavaScript, no upload). (3) Air-gapped systems: Convert on isolated machines
for maximum security. Only use online tools for public or non-sensitive data.
What's the best format for email: HTML table or Excel attachment?
+
HTML tables for visibility; Excel attachments for manipulation.HTML
tables in email body: Recipients see data immediately without opening files.
Perfect for: summaries, dashboards, reports where data is reference-only. Ensure
mobile-responsive CSS with media queries. Excel attachments: Recipients can
sort, filter, analyze data. Better for: datasets requiring manipulation, formulas/charts,
audiences who need raw data. Best practice: Combine both�HTML summary in email
body, Excel attachment for detailed analysis. Always test HTML emails across clients (Gmail,
Outlook) as rendering varies significantly. Use table-based layouts (not divs) for maximum
compatibility.